In the 9 and 10 versions of the Flash Player there are both debug and non-debug versions of those players. If you are writing Flex application you most certainly have the debug version, which lets you output to trace as well as write those trace statements to a log on the local file system of you have the correct settings. There is a problem with the debug version of the Flash Player though, which is that it is full of memory leaks.
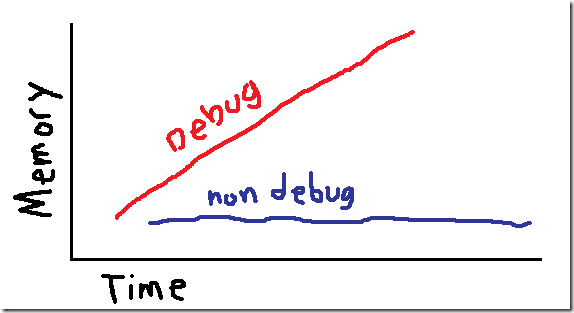
This is important if you are trying to get memory under control in a Flex application, because if you are just looking at the System.totalMemory in the debug player you are wasting your time. This problem with memory and the debug player is most evident if you are using modules, which you can see by loading modules over and over again and comparing System.totalMemory over time in the debug and non-version of the Flash Player.
Using the latest in computer modeling technology the result looks like the following:
This means that if you want to get a realistic picture of memory behavior using System.totalMemory, or by looking at the effect on the containing browser or AIR executable, you have to use the non-debug version of the Flash Player. The debug version of the Flash Player is still useful for looking at memory usage though, but you have to use the profiler.
The profiler memory usage panel displays the amount of memory used by object allocation, and will not correlate with System.totalMemory. How do I know this? Well, I took the time to add up all of the objects listed in Live Objects panel and it always adds up to the amount listed for Current Memory. Overtime System.totalMemory will further diverge from the displayed Current Memory, because the actual memory used will continue to grow because you are using the debug player.
I was never able to find a good explanation of the huge difference between Current Memory and the actual memory consumed by the application when running with the profiler versus the non-debug version of the Flash Player, but I have also found that the memory usage overtime of an application in the profiler according to Current Memory will roughly match the memory usage of that same application overtime run using the non-debug version of the Flash Player. It is a rough match because there is of course other stuff in memory than just object allocations.
The non-debug version of the Flash Player is good for locating a generic problem with memory at the level of “hey, this little application started at 30 MB and is now at 300 MB,” while the profiler is good for narrowing down which instances are leaking. When investigating memory in Flex applications you just have to be aware of how whether you are using the debug or non-debug version of the Flash Player effects your results.


No comments:
Post a Comment